

Suveksa shrestha
-
Posts
9 -
Joined
-
Last visited
1 Follower

Suveksa shrestha's Achievements
")


-
Hello people, I have an assignment at my college.since i knew very bsic on pushover analysis ..i am stuck . There is a one bay one storey with rigid frame with fixed base,the beam is infinitely rigid.A force P KN is acted in the frame with moment if resistance at too of column M, and M on its fixed joint. We are asked to draw pushover curve? How are we supposed to do? Are we to assume a value for P, and similarly finding out M ,using stiffness or flexibilty formula, and assigning hinge points are we to see its deflection on any software,and as the drift mentioned by ATC 40 compare it for IO,LS ,CP,DC? Please provide some insights..thankyou
-
 Suveksa shrestha reacted to a post in a topic:
Acceleration time equation for design spectrum plot
Suveksa shrestha reacted to a post in a topic:
Acceleration time equation for design spectrum plot
-
Acceleration time equation for design spectrum plot
Suveksa shrestha replied to Suveksa shrestha's topic in Students Zone
My assignment was to construct a design response spectrum using Newmark and Hall method for 5% damping for a given peak acceleration 0.25g.The question stated that the peak velocity of 122 cm/sec,peak displacement of 91 cm are consistent with a peak acceleration of 1g. Related to that I had to plot the design response spectrum for 0.25 g.Can you explain,what is meant by consistent?we have been given a formula to to find out peak velocity and displacement in relation to the consistency with 1g but what is it actually? I solved the tripartite graph from the formula given and I plotted the pseudovelocity design spectrum from which at different time instance where after amplification and at time instance 1/33,1/8,10 and 33 sec ,I was able to plot acceleration vs time graph by equation as (A=xTy where,A=acceleration,T=time,x and y comes from solving two equation as example when T=0.02,A=1g,T=0.5,A=5g,from which x and y values were determined).I wonder why are we using this empirical formula. The Spectrum obtained by Newmark and Hall method was then compared with IS 1893 -2000 fig .2 (for hard rock) and was compared.When we plotted the above mentioned acceleration ie 0.25g we didnot know the site condition so maybe ,the plot was different to IS 1893-2002? Noted that the IS 1893 -2000 was for 1g ,we scaled it to 0.25g and was compared.(Please refer to Clause.6.4.2 from IS 1893-2002 and the excel sheet attached herewith ) During this whole process,I don't know why we used a consistent acceleration(as mentioned above) to get a plot for 0.25g? and when we compared it with IS 1893-2000 .Does this means that the consistent acceleration we compared were the available data from previous earthquakes?or is it just empirical assumption? I would be very glad to have insights on the doubt I am actually having.Thankyou tutorial31893&newmarkcomparison.xlsx -
Suveksa shrestha reacted to a post in a topic:
how to model an internal hinge in frame in etabs/sap2000
-
Suveksa shrestha reacted to a post in a topic:
how to model an internal hinge in frame in etabs/sap2000
-
Acceleration time equation for design spectrum plot
Suveksa shrestha posted a topic in Students Zone
Hello all, This might be a minor question to ask .But then I have some queries on the design spectrum plot as per Chopra."Dynamics of Structure"(3rd edition), response spectrum chapter 6.After the plot is made by amplifying given peak acceleration,velocity and displacement.The same is plotted in the tripartite graph ,from where the values corresponding to T=1/33 sec,1/8 sec ,10 sec and 33 sec.why are those coordinate points and the value corresponding to it are noted for obtaining pseudo acceleration or displacement from the relation given ,ie A=omegaVelocity,V=omegaDisplacement?I know how to plot but I am not getting any physical idea about the science of plotting at these points.After this,for each intervals and in place where acceleration governs ,velocity governs and time governs,an equation ,Acceleration(A)=xT^y(where,time is time of consideration of the occurence of acceleration 'A') is used ..Please kindly give me thoughtful insights on why this equation would work to determine the variance of acceleration with the time period of actual structure. -
Hello , I am very grateful for your time on my topic.i would surely like to discuss with you regarding this topic if you can spare me some time.i will get back to you after 2 days now,cause m having my exam..and thankyou very much for your precious comments...i wish to have good discussion with you..i really need good suggestion regarding it
-
Suveksa shrestha reacted to a post in a topic:
Understanding the base shear vs roof displacement graph for Force based Vs Displacement based method
-
Hello all Can we say that if a building has heavy mass,it is called a flexible structure just because w=sqrt(k/m) meaning frequency is low and time period is high.it means the body takes long time to come to rest.if the structure is flexible,as the ground displaces,its base starts undrgoes large deformation,but the structure tries to remain static?does this mean,during earthquake of longer periods,the buildings fail due to large deformation of its base?in flexible structures,the acceleration at the top is almost zero,so earthquake acceleration is very negligible over its inertial mass,right? can you please explain,base isolator are required for flexible buildings? And please explain the response difference between flexible and rigid structures,please enlighten me
-
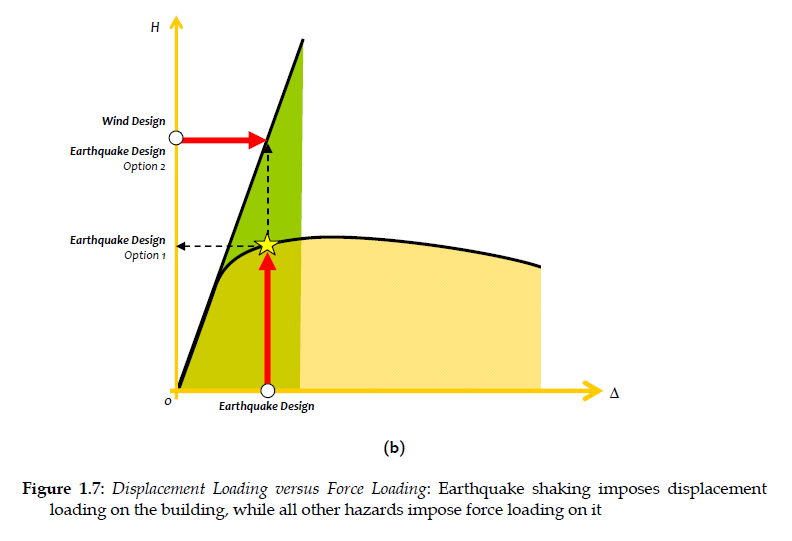
Hello all, 'Difference between Force & Displacement method of building analysis' This has been a topic for my college assignment .And I am going through many literature to understand it.I have even gone through journals which made a comparison between the two cases, following linear analysis for force based and non linear pushover analysis drift comparison for the displacement based approach. I saw one picture somewhere which I have attached here with. During force conventional method of design,the structure has to obey Hooke's law,and For displacement,it can yield as refering to showing ductility(meaning ,it can take further load without failure).I want to write more on this graph,and hopefully I request you to provide more insights regarding this graph.Thankyou
-
Suveksa shrestha reacted to a post in a topic:
Plot of dynamic response vs rise time of load/natural frequency
-
hello. i have a portal frame where the joint between vertical and horizontal member is rigid meaning moment transfer takes place.i want to model the same frame with internal hinge where no moment transfer is posdible.how do i give restraint condition for internal hinge.should i tick mark all translational case in 'assign' restraints options?
-
thankyou sir i will try it again..but when we type the same value in calculator that is sin(6.8) and in excel sin(radians(6.8) both result the same ..so i am confused
-
Suveksa shrestha reacted to a post in a topic:
Plot of dynamic response vs rise time of load/natural frequency
-
hello attached is an excel file for graph plot of a dynamic response for a step force with finite rise time.The formula used is shown in the excel itself. The problem I am having is it is not showing any wave plot even if the formula is correct.what is the mistake ..please correct me your advice will be very helpful to me plotresponse.xlsx